Expenses
Passenger service expenses
In 2019, passenger service expenses amounted to RUB 215.1 billion, up 104.4% year-on-year.
In 2019, by the end of the year, the cost of passenger services totalled RUB 22.99 per 10 passenger-km, or 102.2% compared to the level of 2018.
In 2019, expenses on other activities totalled RUB 15.8 billion, down 2.2% year-on-year.
Lower performance vs 2018 was mostly recorded in income from property lease (67.9% of the 2018 level) due to the expenses incurred under one-off carriage lease contracts with ANO Transport Directorate of the 2018 FIFA World Cup Russia as part of the World Cup 2018, as well as lower overhead costs for other activities.

| Indicators | 2017 | 2018 | 2019 | Change 2019/2018, % |
|---|---|---|---|---|
| Total | 194.4 | 206.1 | 215.1 | 104.4 |
| Payroll costs | 30.4 | 32.6 | 34.0 | 104.4 |
| Social contributions | 8.4 | 8.9 | 9.5 | 106.9 |
| Material costs | 24.9 | 24.5 | 26.4 | 107.9 |
| materials | 5.5 | 6.2 | 6.5 | 105.4 |
| fuel | 0.6 | 0.7 | 0.7 | 104.9 |
| electricity | 0.4 | 0.4 | 0.5 | 106.2 |
| other | 18.5 | 17.1 | 18.7 | 108.9 |
| Other expenses | 118.2 | 126.5 | 129.9 | 102.7 |
| Infrastructure payments | 68.9 | 70.1 | 72.7 | 103.8 |
| Locomotive lease | 41.1 | 45.0 | 46.7 | 103.9 |
| Depreciation | 12.6 | 13.6 | 15.3 | 112.1 |
| Indicators | 2017 | 2018 | 2019 | Change 2019/2018 | |
|---|---|---|---|---|---|
| +/– | % | ||||
| Total | 15.6 | 16.1 | 15.8 | –0.3 | 97.8 |
| Repairs of non-owned rolling stock | 1.4 | 1.3 | 1.5 | 0.2 | 113.9 |
| Additional on-train services | 8.7 | 9.3 | 9.9 | 0.6 | 106.6 |
| Bed linen on trains | 6.4 | 6.8 | 7.0 | 0.2 | 103.0 |
| Premium services | 2.3 | 2.4 | 2.8 | 0.4 | 116.7 |
| Property lease | 2.3 | 2.7 | 1.9 | –0.9 | 67.9 |
| Other services | 3.1 | 2.8 | 2.6 | –0.3 | 90.6 |
Overhauls program
In 2019, actual expenses on overhauls of fixed assets were RUB 5.4 billion, or 112.4% of the 2018 level, including:
- RUB 5.2 billion on overhauls of passenger carriages (% of the 2018 level)
- RUB 0.2 billion on overhauls of buildings and structures performed by third parties – only for facilities in need of an urgent overhaul (up 98.6% year-on-year).
Operational Efficiency and Cost Optimisation Programme
The Company developed an Operational Efficiency and Cost Optimisation Programme for 2018–2020 to enhance FPC’s performance. In 2019, the total impact of the programme was RUB 5.05 billion.
The Programme aims to:
- assess and optimise current expenses
- improve maintenance and repair management for equipment, buildings, and structures
- improve working capital management
- improve fixed asset management
- improve procurement and supply chain management
- streamline the remuneration and motivation system
- optimise headcount
- other activities.
| Indicators | 2017 | 2018 | 2019 | Change 2019/2018, % |
| Total | 5.2 | 4.8 | 5.4 | 112.4 |
| Carriages | 5.0 | 4.6 | 5.2 | 113.0 |
| Buildings and structures | 0.2 | 0.2 | 0.2 | 98.6 |
Headcount and labour productivity
In 2019, labour productivity was up 2.5% year-on-year due to a 2.6% growth in traffic and headcount optimisation. The average headcount in transport services totalled 53,861 FTEs, down 0.1% year-on-year (35 FTEs).
| Indicators | 2017 | 2018 | 2019 | Change 2019/2018, % |
| FPC headcount, FTEs | 60,724 | 58,975 | 58,224 | 98.7 |
| Including in transport services | 55,189 | 53,896 | 53,861 | 99.9 |
| Labour productivity, ‘000 passenger km / FTE | 1,500 | 1,628 | 1,670 | 102.6 |
Other income and expenses
In 2019, the fnancial result from other income and expenses amounted to RUB 3.1 billion.
Key revenues received as part of other FPC’s income were government subsidies allocated as compensation for the revenue shortfall caused by the government regulation of long-distance tariffs for third-class open sleeping and fourth-class seating carriages. In 2019, RUB 7.7 billion in subsidies were received from the federal budget (RUB 8.6 billion in 2018).
Interest expenses on loans were the key item in other expenses, amounting to RUB 4.0 billion in 2019 (RUB 2.8 billion in 2018).
| Indicators | 2017 | 2018 | 2019 | Change 2019/2018, % |
| Other income | 14.0 | 15.6 | 23.6 | 151.3 |
| Interest receivable | 1.3 | 0.8 | 1.0 | 125.5 |
| Proceeds from the disposal of fixed and other assets | 0.3 | 0.8 | 10.1 | 1,268.1 |
| Subsidies from the federal budget | 7.8 | 8.6 | 7.7 | 89.4 |
| Other | 4.7 | 5.4 | 4.8 | 88.2 |
| Other expenses | 9.3 | 10.7 | 20.5 | 192.0 |
| Interest payable | 2.3 | 2.8 | 4.0 | 143.6 |
| Expenses on the disposal of fixed and other assets | 0.2 | 0.4 | 9.6 | 2,403.7 |
| Cash management services | 1.9 | 1.8 | 2.1 | 115.2 |
| Other | 4.8 | 5.7 | 4.8 | 84.8 |
Debt policy
As at 31 December 2019, FPC’s debt amounted to RUB 49.9 billion (excluding a RUB 0.6 billion worth of accrued interest payable in the following quarter), including RUB 1.4 billion of loan liabilities and RUB 48.5 billion of bond liabilities.
FPC had no debt denominated in a foreign currency.
Earlier loans will be repaid in full by the end of 2021.
To secure financing for the Investment Programme, FPC placed a total of RUB 13.5 billion in bonds (2 issues): RUB 8 billion for five years at 8.4% p.a. and RUB 5.5 billion for 6.5 years at 6.9% p.a. In 2019, FPC did not open long-term credit facilities with any credit institutions.
In 2019, FPC did not open long-term credit facilities with any credit institutions.
The nearest maturity date is in 2022, with a total of RUB 38.5 billion of bonds expected to be repaid between 2023 and 2028.
| Indicators | 2020 | 2021 | 2022 | 2023 | 2024 | 2025 | 2026 | 2027 | 2028 |
| Debt settlement | 0.7 | 0.7 | 10.0 | 13.0 | 10.0 | 5.5 | 0.0 | 0.0 | 10.0 |
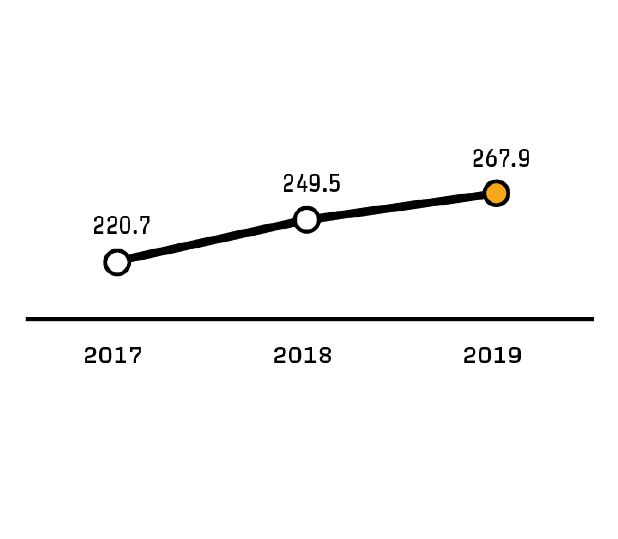
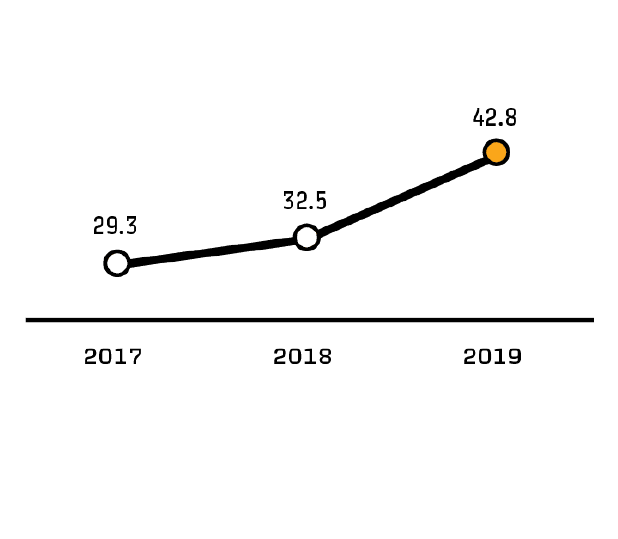
Balance sheet total
In 2019, FPC’s balance sheet total increased by RUB 29 billion, or by 10%.
| Indicators | 2017 | 2018 | 2019 | Change 2019/2018, % |
| Non-current assets | 220.7 | 249.5 | 267.9 | 107.4 |
| Current assets | 29.3 | 32.5 | 42.8 | 131.8 |
| Assets | 250.0 | 282.0 | 310.7 | 110.2 |
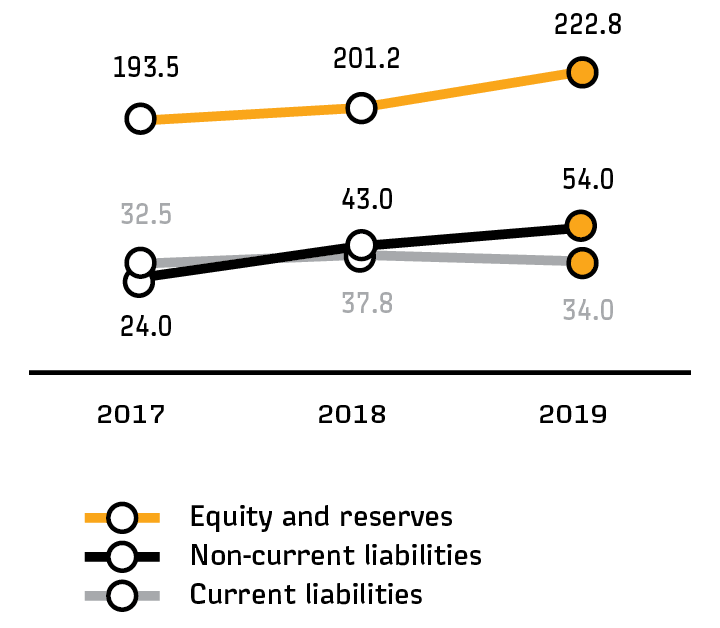
| Equity and reserves | 193.5 | 201.2 | 222.8 | 110.7 |
| Non-current liabilities | 24.0 | 43.0 | 54.0 | 125.3 |
| Current liabilities | 32.5 | 37.8 | 34.0 | 90.0 |
| Liabilities | 250.0 | 282.0 | 310.7 | 110.2 |
As at 31 December 2019, FPC’s non-current liabilities totalled RUB 54 billion, including loans and borrowings for RUB 49.2 billion.
The size of FPC’s share capital as at 31 January 2019 wasRUB 171,961,040,539.
As at 31 December 2019, FPC had 186,961,040,539 ordinary registered uncertified shares issued with the same par value of RUB 1 each.
Shareholding in FPC’s share capital – 99.9999999995%.
Shareholding in JSC KRP-Invest holding – 0.0000000005%.
JSC FPC’s registrar is Company STATUS, which maintains the FPC securities register under contract No. 201-14/FPC-14-216 dated 11 June 2014. On 23 August 2018, FPC opened an account of the National Settlement Depository, the nominal shareholder of the central depository, in its securities register.
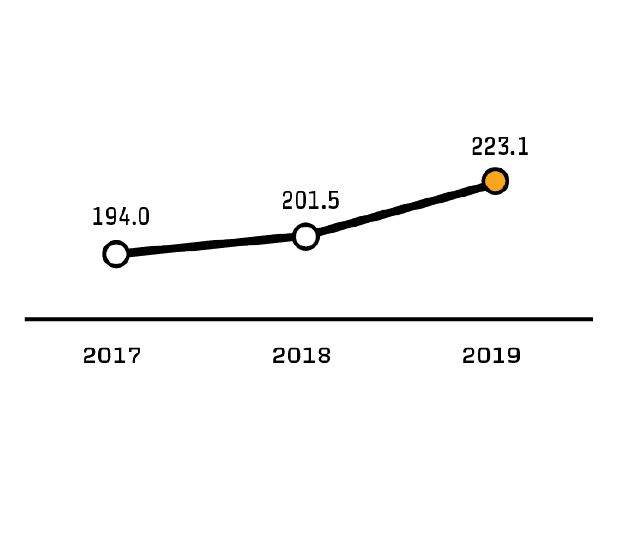
In the reporting year, the Company’s net assets increased by 10.7% to RUB 223.1 billion.
| Indicators | 2017 | 2018 | 2019 | Change 2019/2018, % |
| Net assets | 194.0 | 201.5 | 223.1 | 110.7 |
Inventories
As at 31 December 2019, FPC’s actual inventories amounted to RUB 3.69 billion, including RUB 0.12 billion worth of fuel, against the set standard of RUB 4.029 billion, including RUB 0.19 billion worth of fuel. As at 31 December 2018, FPC’s actual inventories were RUB 3.78 billion, including RUB 0.15 billion worth of fuel.
The total value of FPC’s inventories was down by RUB 0.09 billion, or 2.4%, in 2019, due to the release of inventories into production and sales of wheelsets not used in operations.
Payables and receivables
As at 31 December 2019, FPC’s receivables totalled RUB 15.71 billion.
Taxes and charges receivable were 73.1%, or RUB 11.5 billion.
The largest share of trade receivables was due for repair and maintenance of the rolling stock, amounting to RUB 0.28 billion, or 47.0%, and for the lease of the rolling stock and property assets, amounting to RUB 0.14 billion, or 23.9%.
Trade receivables due for passenger services made up RUB 1.79 billion, or 11.4%, in line with the terms of relevant contracts.
As at 31 December 2019, prepayments totalled RUB 0.97 billion, or 6.2%.
By late December 2019, payables had increased by 9.7% year-on-year to RUB 27.2 billion. The largest share of payables was attributed to trade payables totalling RUB 12.39 billion, or 45.5%, and prepayments for transport services totalling RUB 9.31 billion, or 34.2%.
As payables are above the receivables, the Company can use payables as an additional source of financing. Receivables to payables ratio were 0.58.
| Receivables | 2017 | 2018 | 2019 |
| Total | 12.09 | 11.27 | 15.71 |
| Trade receivables (except for transport services) | 0.82 | 0.49 | 0.59 |
| Trade receivables (for transport services) | 1.15 | 1.07 | 1.79 |
| Prepayments | 0.45 | 0.48 | 0.97 |
| Taxes and charges | 8.53 | 8.11 | 11.49 |
| Other receivables | 1.14 | 1.13 | 0.87 |
| Indicators | 2017 | 2018 | 2019 |
| Total | 24.43 | 24.80 | 27.20 |
| Trade payables | 10.22 | 9.95 | 12.39 |
| Payroll liabilities | 1.45 | 1.48 | 1.59 |
| Taxes and charges, social insurance | 1.65 | 1.87 | 1.25 |
| Prepayments for other activities | 0.64 | 0.29 | 0.26 |
| Prepayments for transport services | 7.82 | 8.70 | 9.31 |
| Other payables | 2.64 | 2.50 | 2.41 |
Cash flowsThe structure of cash flows for investment activities reflects, among other things, the repayment of loans in accordance with the agreement concluded between Russian Railways and FPC on the provision and repayment (repayment) of cash (loans).
As at 1 January 2019, FPC’s balance of cash including short-term deposits totalled RUB 6.5 billion, including RUB 2.4 billion in the current account.
Cash flows from operating activities
In 2019, the cash flow from operating activities totalled RUB 275.7 billion, including RUB 7.7 billion from the federal budget. Most cash (78%) was received from passenger services totalling RUB 215.9 billion less of transit charges.
Operating expenses amounted to RUB 277.6 billion, including expenses for infrastructure services and locomotive lease totalling RUB 143.9 billion, or 51.8%.
Negative cash flow from operating activities was RUB 1.8 billion.
| Indicators | 2017 | 2018 | 2019 |
| Net cash flow | 4.1 | 3.3 | –1.8 |
| Cash received | 254.2 | 267.1 | 275.7 |
| Cash used | 250.0 | 263.8 | 277.6 |
Cash flows from investing activities
Expenses for investment activities totalled RUB 289.3 billion.
In the reporting period, RUB 41.9 billion (96% of investment) were allocated for passenger rolling stock replacement and upgrades, including:
- RUB 30.7 billion for the acquisition of new passenger carriages
- RUB 11.2 billion for upgrades of passenger rolling stock.
Negative cash flow from investing activities amounted to RUB 47.8 billion.
| Indicators | 2017 | 2018 | 2019 |
| Cash flow | –27.5 | –60.6 | –47.8 |
| Cash received | 1.7 | 1.6 | 241.6 |
| Cash used | 29.2 | 62.2 | 289.3 |
Cash flows from financing activities
In 2019, cash received from financing activities was RUB 68.5 billion (of which 34% was attributed to borrowings).
Cash used in the amount of RUB 23.05 billion resulted from:
- interest payments on loans and borrowings – RUB 3.96 billion
- repayment of loans and borrowings – RUB 19.09 billion.
Net cash flows from financing activities totalled RUB 45.5 billion.
FPC’s negative cash flow for the year totalled RUB 4.1 billion.
As at 31 December 2019, FPC’s balance of cash including short-term deposits was RUB 2.4 billion, including RUB 1.7 billion in the current account.
| Indicators | 2017 | 2018 | 2019 |
| Net cash flow | 21.3 | 50.5 | 45.5 |
| Cash received | 43.9 | 55.2 | 68.5 |
| Cash used | 22.6 | 4.7 | 23.0 |
Financial review
| Indicators | 2017 | 2018 | 2019 |
| Liquidity | |||
| Absolute liquidity ratio | 0.41 | 0.45 | 0.67 |
| Quick liquidity ratio | 0.78 | 0.75 | 1.14 |
| Current liquidity ratio | 0.90 | 0.86 | 1.26 |
| Leverage ratio | 0.77 | 0.71 | 0.72 |
| Margins, % | |||
| Sales margin (including subsidies) | 6.25 | 5.35 | 5.60 |
| Return on equity (ROE) | 4.09 | 3.02 | 2.98 |
| Return on assets, including subsidies (ROA) | 3.16 | 2.16 | 2.13 |
| Liabilities | |||
| Liabilities in the balance sheet total | 0.23 | 0.29 | 0.28 |
| Financial leverage (interest-bearing borrowings/equity) | 0.29 | 0.40 | 0.39 |
| Total debt/EBITDA | 0.85 | 1.72 | 1.71 |
| Total debt/revenue (including subsidies) | 0.11 | 0.20 | 0.21 |
Absolute liquidity ratio – 0.67
The ratio is the most stringent solvency criterion. It shows how much short-term debt can be covered by the Company immediately if necessary by the available cash and highly liquid short-term investments.
The ratio increased by 0.22 year-on-year (0.45 in 2018), mostly due to the short-term loans extended by Russian Railways in 2018 (as at 31 December 2019, the balance was RUB 20,550 million).
Quick liquidity ratio – 1.14
The ratio shows how much short-term debt can be covered by the Company if its receivable is fully repaid (payments expected within 12 months after the reporting date).
The ratio increased by 0.39 year-on-year (0.75 in 2018).
Current liquidity ratio – 1.26
The ratio shows how much short-term debt can be covered by the Company by its current assets. In contrast to the absolute and quick liquidity ratios, this indicator shows solvency over a relatively longer term.
The ratio increased by 0.40 year-on-year (0.86 in 2018), which improved the Company’s overall working capital availability to support business operations and repay current liabilities compared to 2018.
Leverage ratio – 0.72x
The ratio shows the share of the Company’s assets that are covered by its funds. The higher the ratio, the more financially stable the Company is and the lower its dependence on third-party loans. From an investor or creditor’s perspective, the higher the ratio, the lower the risk of losing investments in the Company or loans extended to it.
The ratio increased by 0.01 year-on-year (0.71 in 2018), a sign of the Company’s increased financial stability.
Sales margin (including subsidies) – 5.60
It is an indicator of the Company’s financial performance, showing the share of profit in its revenue. Sales margin is a metric showing the effectiveness of the Company’s pricing policy and its ability to control costs, as well as indicating the share of gross profit in the Company’s sales.
The ratio increased by 0.25 p.p. year-on-year (5.35% in 2018), suggesting an increase in the share of gross profit in total sales.
Return on equity (ROE) – 2.98
It is one of the key metrics of the Company’s performance, used to evaluate its investment case over the longer term and showing how many units of net profit the Company generates with each unit of shareholders’ equity.
The ratio decreased by 0.04 p.p. year-on-year (3.02% in 2018).
Return on assets, including subsidies (ROA) – 2.13
This financial ratio shows the return on all assets used by the Company, indicating the Company’s ability to generate profit without taking into account its capital structure (financial leverage), as well as the quality of asset management.
The ratio slightly decreased by 0.03 p.p. year-on-year (2.16% in 2018).
Liabilities in the balance sheet total – 0.28
The lower share of borrowings in the balance sheet total (0.29 in 2018) demonstrates the trend of stronger financial stability of the Company. Accordingly, the higher the percentage of own funds in the balance sheet total, the better the financial position of the Company.
Financial leverage (interest-bearing borrowings/equity) – 0.39
Financial leverage indicates the ratio of borrowings to total capitalisation, showing how efficiently the Company uses equity, as well the degree of its reliance on borrowings. The capitalisation ratio is used only in the same industry context and in the context of the Company’s revenue and cash flows.
Total debt/EBITDA – 1.71x
This indicator shows the Company’s debt burden and its ability to repay existing liabilities (solvency).
The ratio slightly decreased by 0.01 year-on-year (1.72x in 2018).
Total debt/revenue (including subsidies) – 0.21x
This indicator shows the Company’s debt burden vs its total revenue (0.20x in 2018).