Financial results
Revenue
| Indicators | 2017 | 2018 | 2019 | Change 2019/2018, % |
| Total | 216.2 | 226.1 | 236.9 | 104.8 |
| Passenger services | 193.7 | 202.4 | 213.4 | 105.5 |
| Deregulated segment | 95.1 | 104.3 | 109.2 | 104.7 |
| First-class and second-class sleeping carriages | 81.0 | 89.8 | 95.1 | 106.0 |
| International services | 14.1 | 14.6 | 14.0 | 96.5 |
| Regulated segment | 98.6 | 98.1 | 104.2 | 106.3 |
| Passenger services | 91.6 | 91.4 | 98.1 | 107.4 |
| third-class open sleeping carriages | 85.6 | 85.2 | 91.4 | 107.3 |
| fourth-class seating carriages | 6.0 | 6.2 | 6.8 | 109.5 |
| Baggage, unaccompanied baggage, and mail transport | 7.0 | 6.7 | 6.1 | 90.8 |
| Revenue from other activities | 22.5 | 23.7 | 23.4 | 98.7 |
| Repair and maintenance of non-owned rolling stock | 1.9 | 1.7 | 1.9 | 111.0 |
| Additional on-train services | 11.7 | 12.4 | 13.5 | 108.7 |
| Premium services | 3.3 | 3.4 | 3.7 | 110.0 |
| Bed linen on trains | 8.4 | 9.1 | 9.8 | 108.3 |
| Other lines of business (property lease to third parties, agency contracts) | 8.9 | 9.6 | 8.0 | 83.5 |
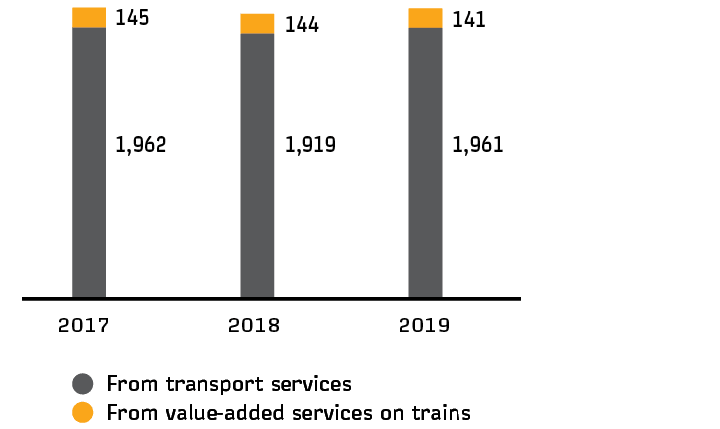
Revenue from passenger services
In 2019, revenue from passenger services amounted to RUB 213.4 billion, up 5.5% year-on-year.
In 2019, the Company’s overall passenger traffic increased by 2.2% year-on-year, which was the key driver behind the increased revenue from passenger services.
Revenue in the deregulated segment amounted to RUB 95.1 billion on domestic routes, up 6.0% year-on-year due to increased demand from passengers for this type of services amidst the annual fare growth of no more than 2%–3% on average.
Revenue from international services totalled RUB 14.0 billion, down 3.5% year-on-year, due to reduced traffic on trains made up in the CIS and Baltic states. A 7.4% year-on-year increase in revenue from passenger services in third-class open sleeping carriages and fourth-class seating carriages was driven by higher population mobility in 2019, also observed in the regulated segment, and a 3.9% tariff indexation by the government.
Revenue from baggage, unaccompanied baggage, and mail transport was down 9.2% year-on-year to RUB 6.1 billion due to an average year-on-year reduction of 13.6% in the mileage of baggage and mail carriages.
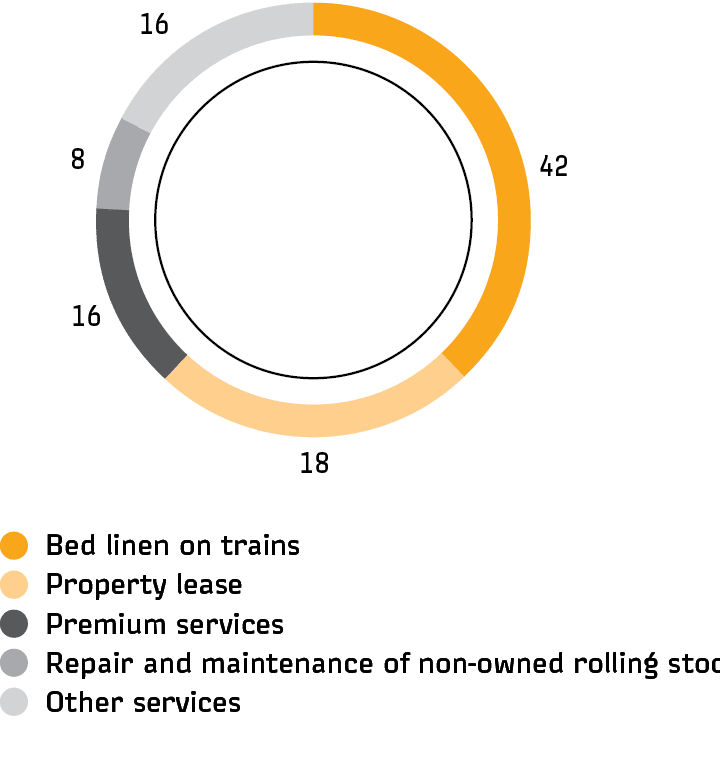
Revenue from other activities
Other FPC activities include:
- repairs of non-owned rolling stock
- additional on-train services
- lease of the rolling stock and property assets
- other services.
In 2019, revenue from other activities totalled RUB 23.4 billion, up 1.3% 2018 year.
Lower performance vs 2018 was mostly recorded in income from property lease (76.5% of the 2018 level) as a result of income recognition in 2018 for payments under one-off carriage lease contracts with ANO Transport Directorate of the 2018 FIFA World Cup Russia as part of the World Cup 2018, as well as with the Central Directorate for Infrastructure, a branch of Russian Railways, for the arrangement of employee accommodation.
| Indicators | 2017 | 2018 | 2019 | Change 2019/2018 | |
| +/– | % | ||||
| Total | 22.5 | 23.7 | 23.4 | –0.3 | 98.7 |
| Repairs of non-owned rolling stock | 1.9 | 1.7 | 1.9 | 0.2 | 111.0 |
| Additional on-train services | 11.7 | 12.4 | 13.5 | 1.1 | 108.7 |
| Bed linen on trains | 8.4 | 9.1 | 9.8 | 0.8 | 108.3 |
| Premium services | 3.3 | 3.4 | 3.7 | 0.3 | 110.0 |
| Property lease | 5.4 | 5.6 | 4.3 | –1.3 | 76.5 |
| Other services | 3.5 | 3.9 | 3.7 | –0.3 | 93.4 |